 汉语
汉语
 English
 Français
 Deutsch




Direct Answer: Aerosolization combined with Scanning Mobility Particle Sizing (SMPS) provides an accurate, high-resolution method for measuring the particle size distribution (PSD) of Chemical Mechanical Planarization (CMP) slurries. Unlike dynamic light scattering (DLS), which is biased toward larger particles and has difficulty resolving multiple size populations, the Nano LPM™ Generator + SMPS technique aerosolizes a diluted slurry sample and measures individual dried particles by electrical mobility — identifying distinct particle size peaks in about 2 minutes per scan. This method has been validated against NIST-traceable polystyrene latex (PSL) standards and confirmed by TEM image analysis, making it suited for CMP slurry R&D, QA/QC, and inline process monitoring.
Table of Contents
- What Is CMP Slurry and Why Does Particle Size Distribution Matter?
- How Is CMP Slurry Particle Size Measured Today? TEM, SEM, and DLS Compared
- Aerosolization + SMPS: A More Accurate Way to Measure CMP Slurry Particle Size
- Validating Accuracy with NIST-Traceable Polystyrene Latex (PSL) Standard Particles
- Silica CMP Slurry Case Study: Nano LPM™ Generator+SMPS vs. DLS vs. TEM Results
- Conclusion: Why Nano LPM™ Generator+SMPS Is a Gold-Standard Method for CMP Slurry Particle Sizing
- References
1. What Is CMP Slurry and Why Does Particle Size Distribution Matter?
Chemical Mechanical Planarization (CMP) slurries are complex, multicomponent colloidal systems comprising abrasive nanoparticles dispersed within a liquid chemical matrix. The abrasive phase may consist of silica, ceria, copper or other materials. The liquid phase typically includes oxidizers, corrosion inhibitor s, surfactants, dispersants, and polymeric additives designed to optimize wafer surface interactions and slurry stability. The interplay between chemistry and mechanical abrasion governs the material removal process. An example of a typical silica slurry can be seen in the image.
A critical determinant of slurry performance is the particle size distribution (PSD) of the abrasive particles it contains. The PSD influences critical process metrics including material removal rate (MRR), within-wafer non-uniformity (WIWNU), surface roughness, and the presence of defects (Cho, et al. 2026). In particular, the tail of the PSD, which is comprised of oversized particles and agglomerates, has a disproportionate impact on scratch generation and yield loss. Conversely, the fine fraction of the distribution contributes to surface smoothness and chemical reactivity.
Achieving reproducible performance requires precise control of the full PSD across several orders of magnitude, from a few nanometers to hundreds of nanometers.
2. How Is CMP Slurry Particle Size Measured Today? TEM, SEM, and DLS Compared
Several established techniques can be used to measure slurry abrasive particle size distribution. A highly accurate, but time consuming method, is transmission or scanning electron microscopy (TEM/SEM), where a sample of the slurry is dried onto a substrate, and the sample is then imaged. Another example, dynamic light scattering (DLS) is a technique that is often currently used for characterizing the PSD of CMP slurries. DLS is an optical technique based on the intensity of light scattered from particles in a liquid. One advantage of DLS is that it works well for determining the size of mono-modal particle size distributions at sizes larger than about 30nm.
Several disadvantages include difficulty in identifying multiple size modes, making assumptions about the shape of the particle size distribution, a strong bias to larger particles because he scattered light intensity is proportional to the diameter of the particle to the 6th power. and an inability to identify smaller particles.
3. Aerosolization + SMPS: A More Accurate Way to Measure CMP Slurry Particle Size
Aerosolization and SMPS, also referred to as the spray-drying technique, offers a method of measuring the particle size distribution (PSD) of a slurry sample in a robust and repeatable way with a high degree of accuracy and resolution.
The Nano LPM™ Generator is one such atomizer that can be used for spray-drying liquids. It is designed to be integrated into a UPW system, and therefore is “self-cleaning,” in the sense that clean UPW is constantly running through the atomizer. It also has an injection port that enables the user to inject liquid samples – such as CMP slurry – to be atomized, and the resulting droplets to be dried into solid aerosol particles.
Scanning mobility particle sizing is a well-established (aerosol) particle sizing technique that uses the principle of electrical mobility to measure particle sizes quickly and accurately. It is used by calibration and standards labs around the world as a gold-standard technique for sub-micron particle sizing. More details on how an SMPS works can be found in Wang and Flagan (1990).
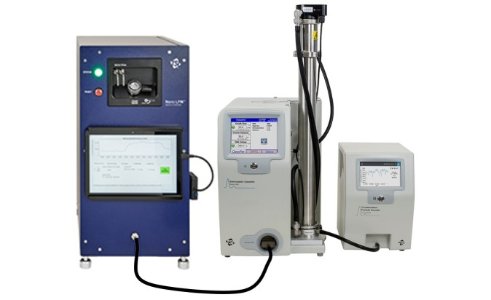 When the Nano LPM™ Generator and the SMPS are used together, a diluted slurry sample is injected into the front port of the generator and a switching valve is actuated. In about 2 minutes, the sample is transported through a unique 2-stage atomization nozzle that breaks the liquid into a larger number of very small droplets. These droplets then pass through a drying element which evaporates the liquid, leaving only the non-volatile aerosol behind.
This aerosol (dry particles in air) is then passed to the SMPS via a conductive tube (this avoids losses due to static electricity), where each particle that passes through the outlet of the differential mobility analyzer (DMA) column is counted and the particle size distribution is measured.
For slurries, a typical SMPS scan takes 2 minutes and is independent of the optical properties of the particles being measured. SMPS systems are available in several configurations that will measure particles as small as 1 nm, and as large as 1000 nm.
4. Validating Accuracy with NIST-Traceable Polystyrene Latex (PSL) Standard Particles
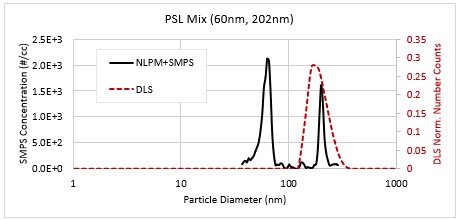
A mixture of ultrapure water (UPW) and polystyrene latex (PSL) particles was tested in the Nano LPM™ Generator and SMPS system for verification purposes. The PSL particles used are NIST traceable, with nominal sizes of 60 nm and 202 nm, respectively. The PSL particles were both introduced to the UPW, and the sample was then tested using a dynamic light scattering measurement system (Malvern ZetaSizer Nano-S).
The results of both tests can be seen in Figure 1:
-and-DLS-(red)-results-from-measurements-of-a-mixture-of-UPW-60-nm-and-202-nm-PSL-particles.jpg)
The DLS system identifies one size peak (which is typical of DLS results) at around 164 nm. The Nano LPM™ Generator and SMPS system clearly identifies two peaks, at 63.8 and 201.7 nm, respectively. The SMPS measurements show excellent agreement with the actual PSL particle sizes.
5. Silica CMP Slurry Case Study: Nano LPM Generator+SMPS vs. DLS vs. TEM Results
.jpg) A silica slurry was also measured using DLS and the Nano LPM™ Generator + SMPS systems. A transmission electron microscope (TEM) image of the silica particles dried onto a substrate, can be seen in the image on the right hand side. Note that a sample 20nm and 100nm “particle” are super-imposed onto the image for reference, showing that even visually, it can be surmised that the PSD of this slurry will have primarily two (2) main size modes.
A silica slurry was also measured using DLS and the Nano LPM™ Generator + SMPS systems. A transmission electron microscope (TEM) image of the silica particles dried onto a substrate, can be seen in the image on the right hand side. Note that a sample 20nm and 100nm “particle” are super-imposed onto the image for reference, showing that even visually, it can be surmised that the PSD of this slurry will have primarily two (2) main size modes.
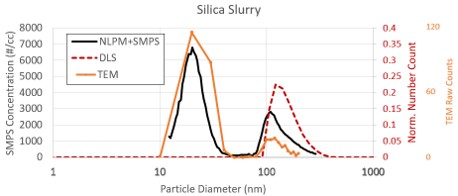
The TEM images were analyzed using an image analysis and edge detection tool (ImageJ) in order to quantitatively extract the particle size distribution of the particles in the images. Over 330 particles were identified and measured, and the results can be seen in Fig. 2 along with the results from the DLS and Nano LPM Generator + SMPS measurements:
-DLS-(red)-and-TEM-(orange)-results-from-measurements-of-the-silica-slurry.jpg)
The DLS measurement indicates a single peak around 122 nm, while the Nano LPM Generator + SMPS reveals two distinct particle size peaks, one at 20.2 nm, and the other at 109.4 nm. These PSD peaks are consistent with the quantitative particle sizes both seen and measured in the TEM images (20 nm and 110 nm, respectively). These results can be seen in Table 1 below:
| Peak #1 (nm) | Peak #2 (nm) | |
|---|---|---|
| TEM | 20 | 110 |
| NLPM+SMPS | 20.2 | 109.4 |
| DLS | n/a | 122 |
6. Conclusion: Why Nano LPM Generator+SMPS Is a Gold-Standard Method for CMP Slurry Particle Sizing
The results presented herein demonstrate that the Nano LPM Generator coupled with Scanning Mobility Particle Sizing (SMPS) provides a robust and high-resolution approach for characterizing the particle size distribution of CMP slurries, particularly in systems exhibiting multimodal or highly polydisperse abrasive particle content.
Unlike dynamic light scattering (DLS), which intrinsically biases measurements toward larger particles due to the strong dependence of its signal on particle diameter, the Nano LPM Generator + SMPS methodology offers number-based size distributions with minimal sensitivity to optical properties, such as refractive index.
Validation using NIST-traceable polystyrene latex (PSL) standards confirms the ability of the technique to accurately resolve discrete particle populations with excellent agreement to nominal sizes. More importantly, in practical slurry systems such as silica-based CMP formulations, the method successfully identifies multiple particle size modes that are obscured in conventional DLS measurements. These results are further corroborated by TEM image analysis, underscoring the quantitative reliability of the approach.
Detection and quantification of sub-30 nm particles, as well as large particles >> 100 nm, enable improved control over slurry formulation, filtration strategies, and overall defectivity reduction.
Furthermore, the combination of rapid measurement time (~2 minutes) and high repeatability mean that this measurement scheme – aerosolize, then measure with SMPS – can provide significant insight for R&D, QA/QC, and in an inline monitoring setting.
In summary, the Nano LPM Generator + SMPS technique represents a significant advancement in CMP slurry metrology, providing the resolution, accuracy, and dynamic range necessary to meet the demands of next-generation semiconductor manufacturing. Its application enables more precise engineering of slurry formulations, ultimately contributing to improved planarization performance, reduced defectivity, and enhanced device yield.
7. References
- Seongmin Cho et al 2026 Meas. Sci. Technol. 37 235003
- Wang, S. C., and Flagan, R. C. (1990). Scanning Electrical Mobility Spectrometer. Aerosol Sci. Technol., 13:230–240.
- Application Note: CMP Slurry Characterization Using Nano LPM™ Generator and SMPS - Silica